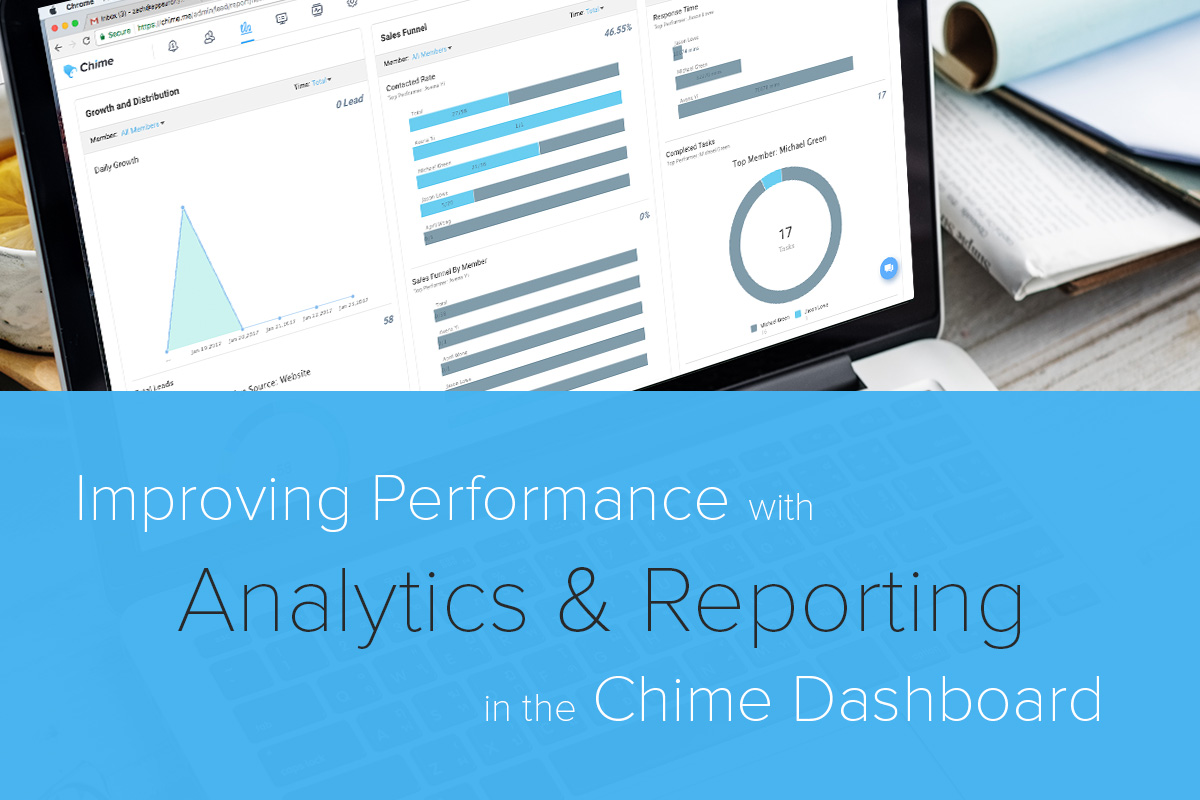
By now you’ve understood the power of email drip campaigns and you’re on your way to mastering email marketing best practices for real estate agents just like yourself, but there’s another tool in Chime you haven’t taken advantage of yet.
The Reporting tab in your Chime CRM is one of the most powerful tools available to you. Whether you run a hundred seat brokerage with multiple lenders, or you’re a top-performing, independent lone wolf, the importance of data and reporting cannot be stressed enough.
Old School Anecdotal Versus New School Scientific.
Real estate is a business, and running a business requires solid book keeping as well as a strong team strategy. Gauging how you and your team has performed historically will help you pinpoint what strategies are working and what issues require solutions.
The Reporting tab in Chime is designed to provide you a holistic view of your performance, which is pivotal for measuring team success.
Verbal promises cannot be quantified. Your listing agent might have said it’s been an hour or two since she last contacted the seller, but your Reporting tab (and even Activities tab, too) says she’s been MIA from her computer for over a day!
With the Reporting tab, you can finally shed light on your didactic buyers agent, who has a solid lead conversion strategy but could never put data behind her success.
Overview & Highlights to Get You Started.
When you login on to your Chime CRM, select the Reporting tab at the top of your screen.

Depending on the volume of leads and data, it may take a few seconds for your Reporting tab to fully populate. When it’s done loading, your screen will look like our sample account below.
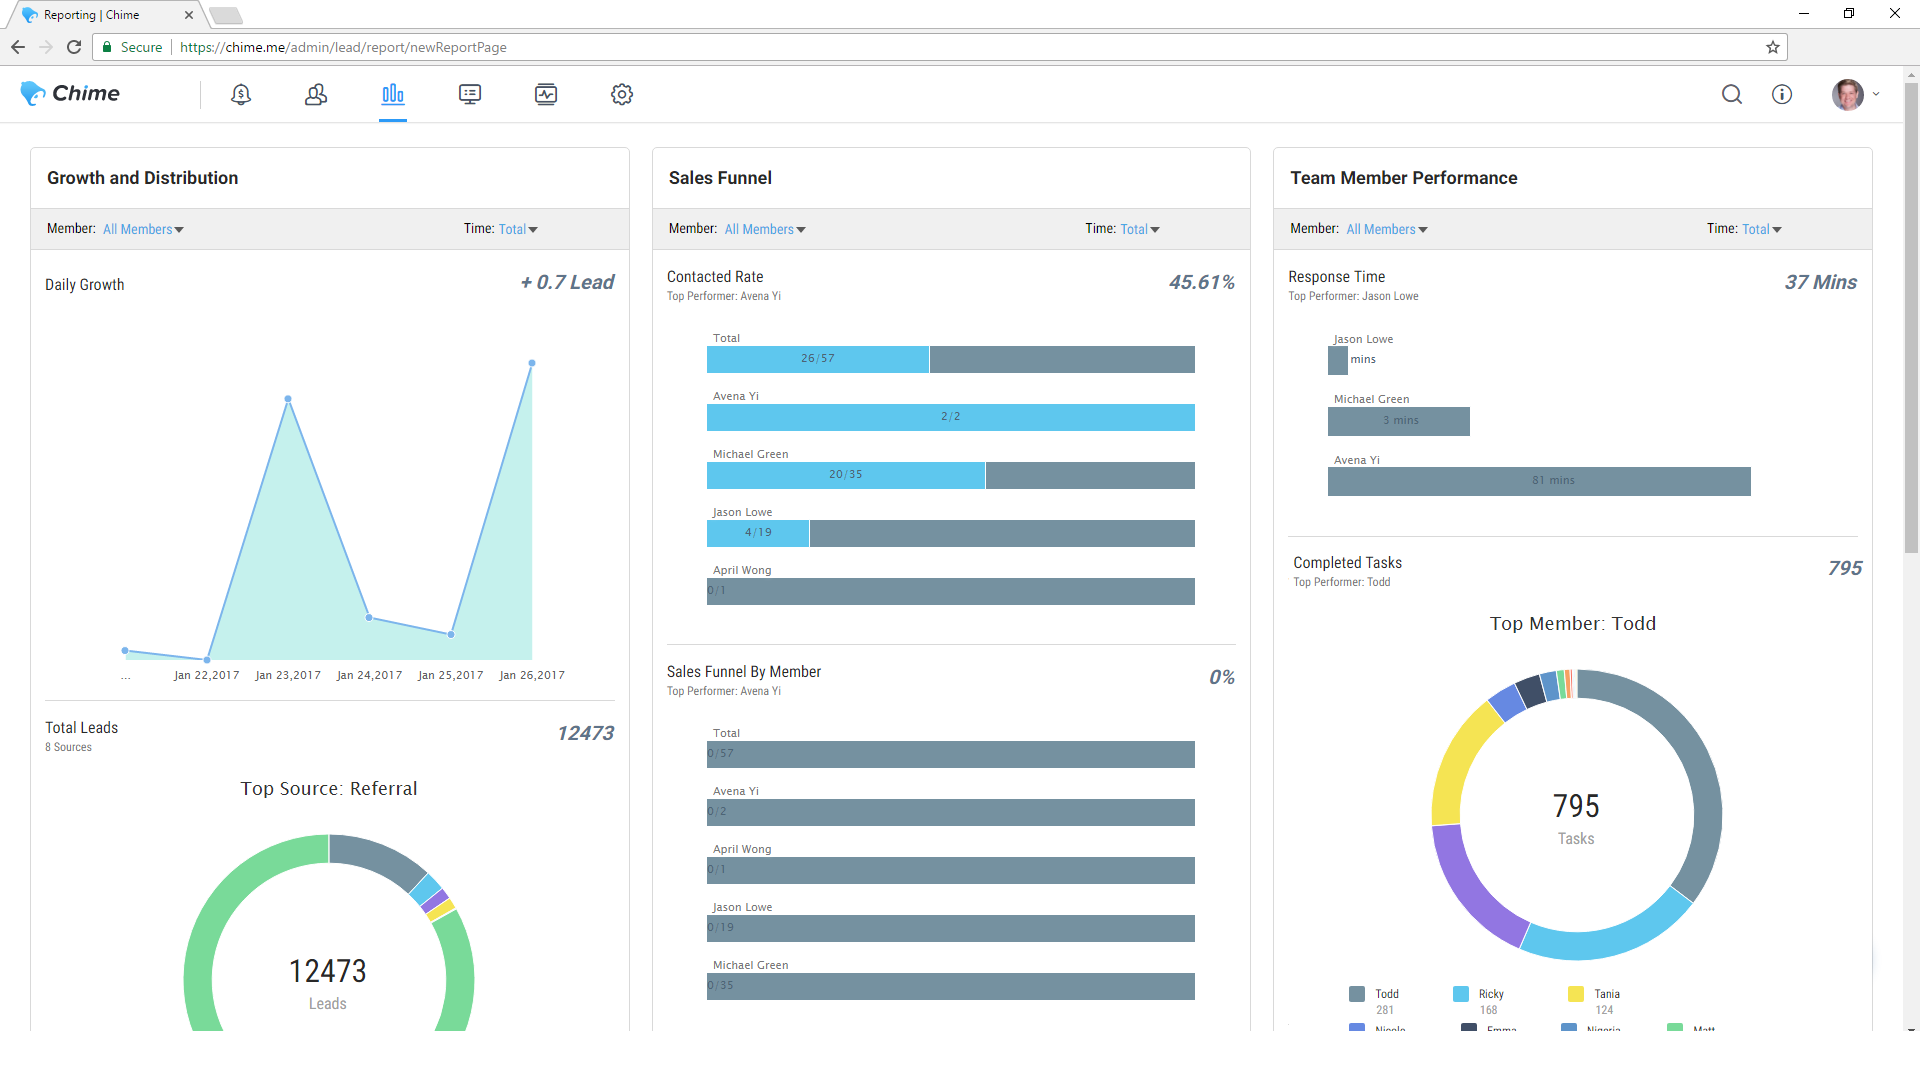
Your dashboard is broken down into three columns: Growth and Distribution, Sales Funnel, and Team Member Performance with widgets. Lead generation is handled 100% by our social intelligence algorithm, but we like you show you the volume of leads and sources to keep you in the loop. You’ll see a breakdown of leads by source as well as zip code. Because our lead generation is zero-touch, we’ll skip over the Growth and Distribution column and look at just the Sales Funnel and Team Member Performance.
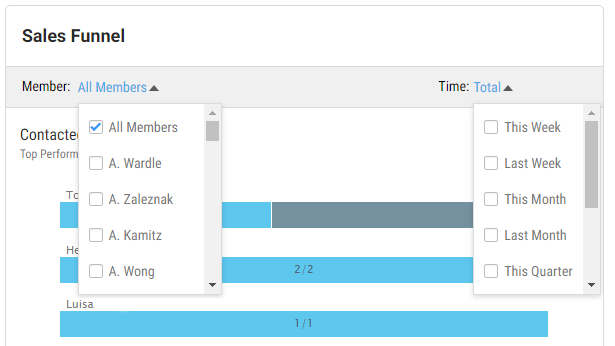
At the top of the Sales Funnel column, you’ll find your team members sorted by contacted rate, with total team performance at the top. The two menus above (Members and Time) allow you to drill down by individual metrics to view any team member(s) versus any time frame.
The Contacted Rate in the Sales Funnel column allows you to view how many assigned leads team members have touched. If you notice a member is slipping behind, you can cross compare their contacted rate against their response time in the Team Member Performance widget on the right. For example, if your buyers agent has a 25% lower contacted rate than the team average, you might notice their response rate is very high, which could mean your team member has too many leads to handle.
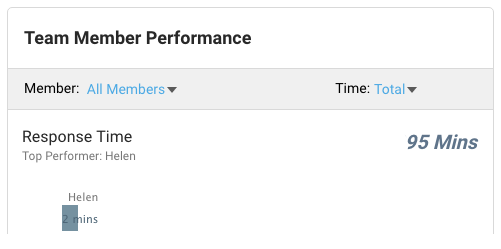
In the column on the right, the first widget you’ll see is Response Time. At the top of the widget, you’ll see your team’s top performer as well as the average time for the whole team. Response Time is sorted by default by the top performer, but you can also drill down based on team member versus time period.
Below the Response Time widget, you’ll find three critical additional widgets: Completed Tasks, Emails Sent, and Calls Made.
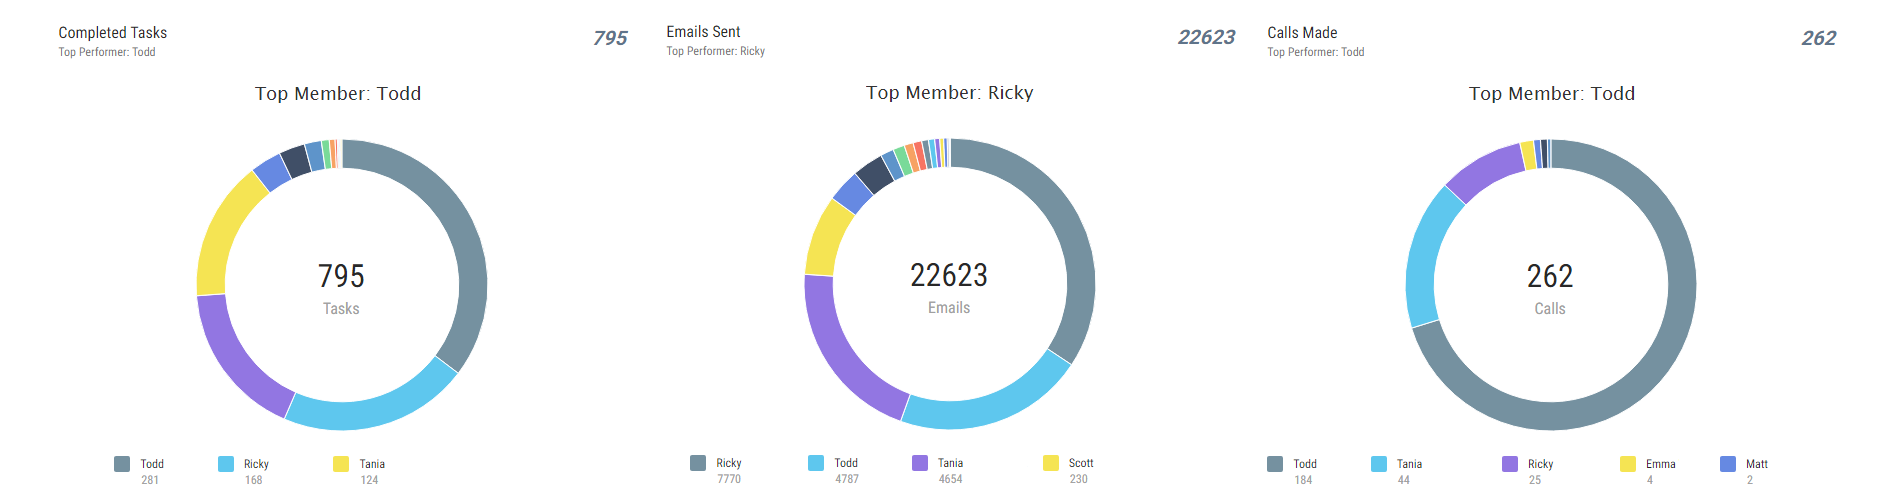
As an admin, you can assign tasks to each lead, which will show up in the to do list for the team member responsible for that lead. When the team member completes a task (whether it’s calling the lead or sending an email), it’s logged in the Completed Tasks widget as well as the corresponding Emails and Calls widgets when applicable.
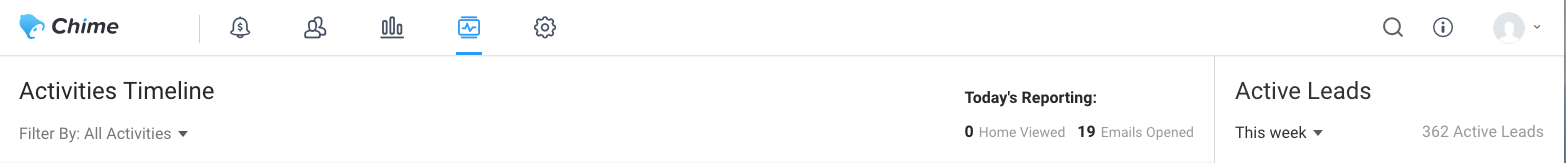
If you want to drill down further and measure engagement between a specific member and their leads, select Activities Timeline from the top of your screen. This will give you a holistic view of communication between your team and leads.
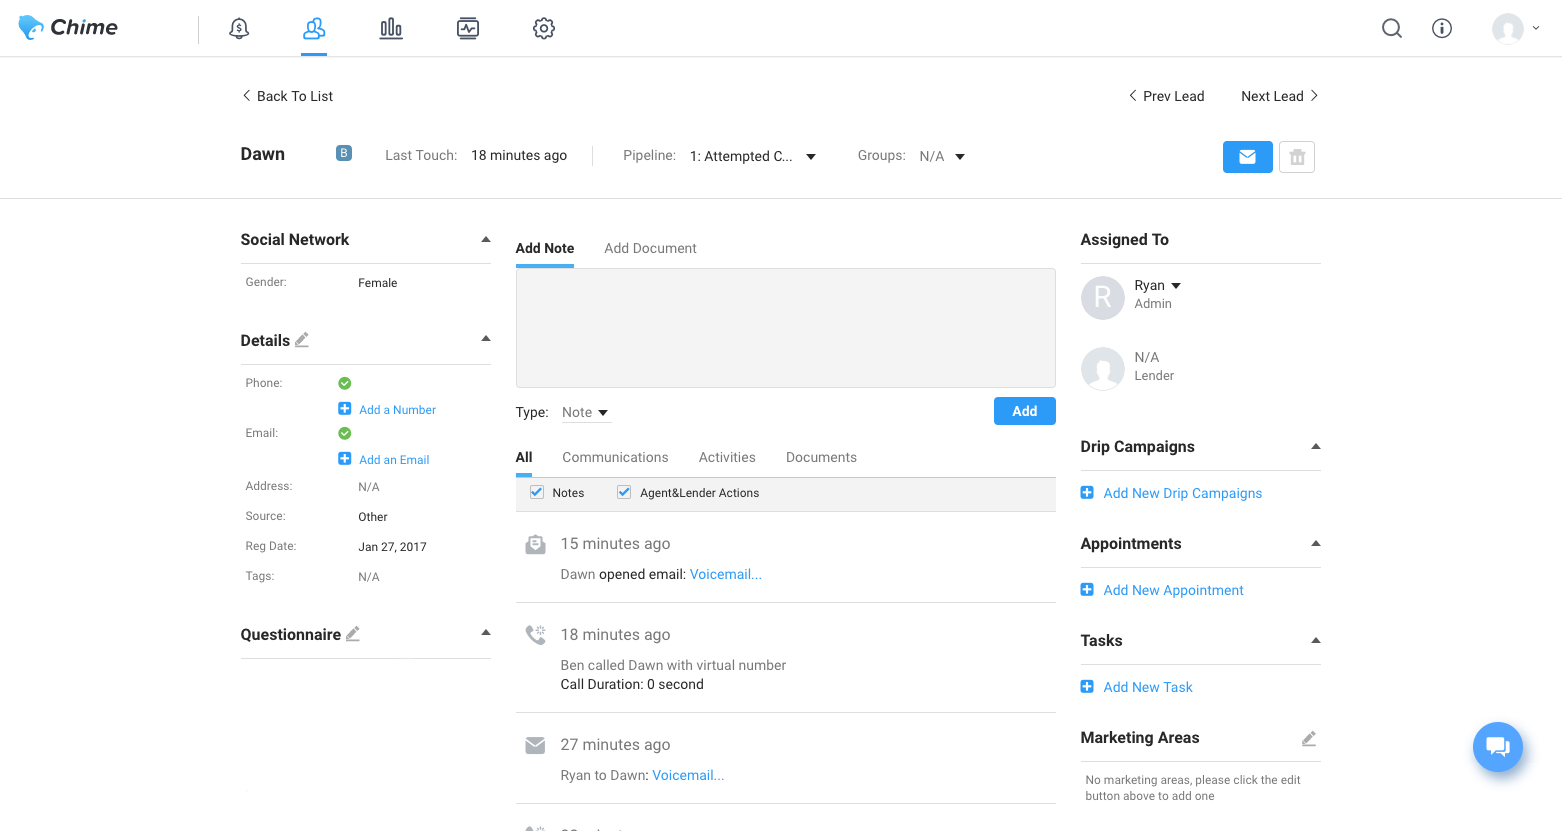
If you want to drill down even further, you can manually select a lead from the Leads page and view just the communication and engagement on a per-lead basis.
Now that you have a solid understanding of the Reporting tab and how it works alongside other Chime features, you can now benchmark, measure, and test different strategies and solutions.
Make sure you read our blog on email drip campaigns as well as email marketing best practices! Stay tuned for our blog on how to run effective sales meetings.